Unit 2.3 Extracting Information from Data, Pandas
Data connections, trends, and correlation. Pandas is introduced as it could be valuable for PBL, data validation, as well as understanding College Board Topics.


- Pandas and DataFrames
- Cleaning Data
- Extracting Info
- Create your own DataFrame
- Example of larger data set
- APIs are a Source for Writing Programs with Data
- Hacks
Pandas and DataFrames
In this lesson we will be exploring data analysis using Pandas.
- College Board talks about ideas like
- Tools. "the ability to process data depends on users capabilities and their tools"
- Combining Data. "combine county data sets"
- Status on Data"determining the artist with the greatest attendance during a particular month"
- Data poses challenge. "the need to clean data", "incomplete data"
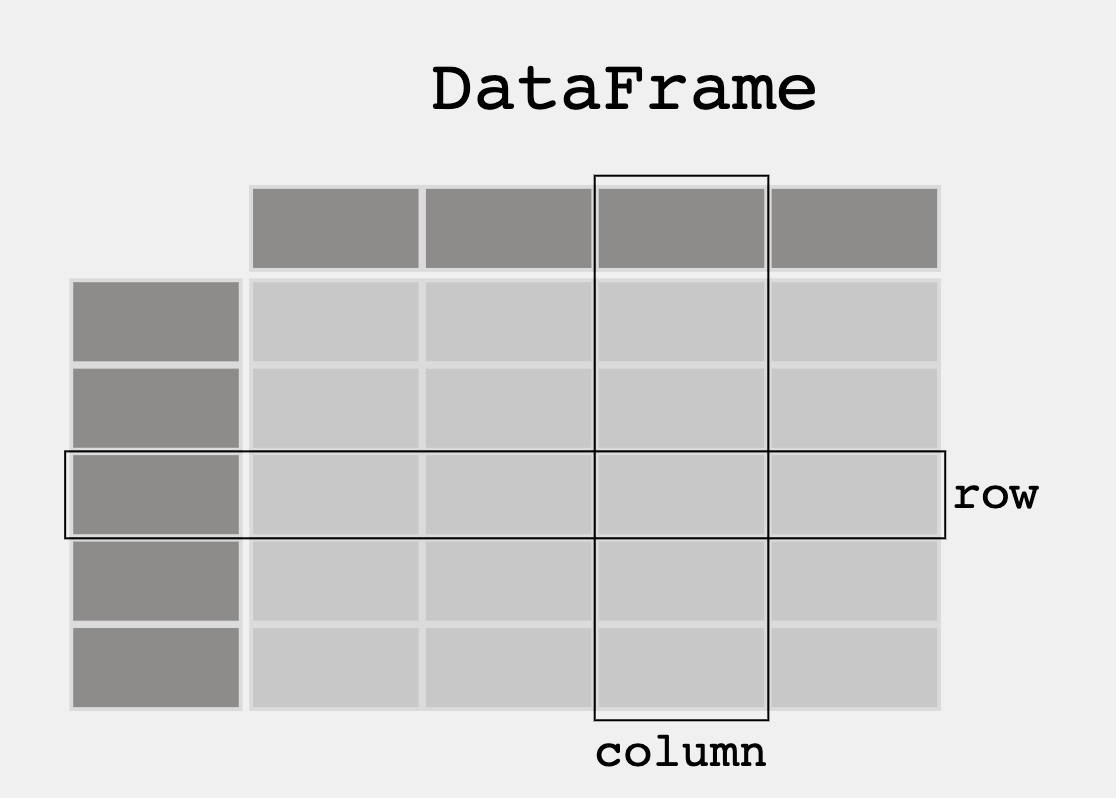
- From Pandas Overview -- When working with tabular data, such as data stored in spreadsheets or databases, pandas is the right tool for you. pandas will help you to explore, clean, and process your data. In pandas, a data table is called a DataFrame.
'''Pandas is used to gather data sets through its DataFrames implementation'''
import pandas as pd
df = pd.read_json('files/grade.json')

print(df)
# What part of the data set needs to be cleaned?
# From PBL learning, what is a good time to clean data?  Hint, remember Garbage in, Garbage out?
print(df[['GPA']])

print()

#try two columns and remove the index from print statement
print(df[['Student ID','GPA']].to_string(index=True))
print(df.sort_values(by=['GPA']))

print()

#sort the values in reverse order
print(df.sort_values(by=['GPA'], ascending=True))
print(df[df.GPA > 3.00])
print(df[df.GPA == df.GPA.max()])
print()
print(df[df.GPA == df.GPA.min()])
import pandas as pd

#the data can be stored as a python dictionary
dict = {
  "calories": [420, 380, 390],
  "duration": [50, 40, 45]
}
#stores the data in a data frame
print("-------------Dict_to_DF------------------")
df = pd.DataFrame(dict)
print(df)

print("----------Dict_to_DF_labels--------------")

#or with the index argument, you can label rows.
df = pd.DataFrame(dict, index = ["day1", "day2", "day3"])
print(df)
print("-------Examine Selected Rows---------")
#use a list for multiple labels:
print(df.loc[["day1", "day3"]])

#refer to the row index:
print("--------Examine Single Row-----------")
print(df.loc["day1"])
print(df.info())
import pandas as pd

#read csv and sort 'Duration' largest to smallest
df = pd.read_csv('files/data.csv').sort_values(by=['Duration'], ascending=False)

print("--Duration Top 10---------")
print(df.head(10))

print("--Duration Bottom 10------")
print(df.tail(10))
'''Pandas can be used to analyze data'''
import pandas as pd
import requests

def fetch():
    '''Obtain data from an endpoint'''
    url = "https://flask.nighthawkcodingsociety.com/api/covid/"
    fetch = requests.get(url)
    json = fetch.json()

    # filter data for requirement
    df = pd.DataFrame(json['countries_stat'])  # filter endpoint for country stats
    print(df.loc[0:5, 'country_name':'deaths']) # show row 0 through 5 and columns country_name through deaths

fetch()
College Board practice problems for 2.3
 Q1: A researcher is analyzing data about students in a school district to determine whether there is a relationship between grade point average and number of absences. The researcher plans on compiling data from several sources to create a record for each student. Upon compiling the data, the researcher identifies a problem due to the fact that neither data source uses a unique ID number for each student. Which of the following best describes the problem caused by the lack of unique ID numbers?
- Students who have the same name may be confused with each other.
- A unique identifier would be required in order to distinguish between two students with the same first and last names.
Q2: A team of researchers wants to create a program to analyze the amount of pollution reported in roughly 3,000 counties across the United States. The program is intended to combine county data sets and then process the data. Which of the following is most likely to be a challenge in creating the program?
- Different counties may organize data in different ways.
- It will be a challenge to clean the data from the different counties to make the data uniform. The way pollution data is captured and organized may vary significantly from county to county.
Q3: A student is creating a Web site that is intended to display information about a city based on a city name that a user enters in a text field. Which of the following are likely to be challenges associated with processing city names that users might provide as input?
- Users might enter abbreviations for the names of cities or Users might misspell the name of the city.
- Different users may abbreviate city names differently. This may require the student to clean the data to make it uniform before it can be processed.
Q4: A database of information about shows at a concert venue contains the following information: Name of artist performing at the show, Date of show, Total dollar amount of all tickets sold. Which of the following additional pieces of information would be most useful in determining the artist with the greatest attendance during a particular month?
- Average ticket price
- This makes sense because if an artist's ticket cost more, they are considered more valuable, and the reason why a person might be considered more valuable is because they are more popular.
Q5: A camera mounted on the dashboard of a car captures an image of the view from the driver’s seat every second. Each image is stored as data. Along with each image, the camera also captures and stores the car’s speed, the date and time, and the car’s GPS location as metadata. Which of the following can best be determined using only the data and none of the metadata?
- The number of bicycles the car passed on a particular day
- Determining the number of bicycles the car encountered would require the use of image recognition software to examine the images collected by the camera. The images are the data collected and no metadata would be required.
Q6: A teacher sends students an anonymous survey in order to learn more about the students’ work habits. The survey contains the following questions. Which of the following questions about the students who responded to the survey can the teacher answer by analyzing the survey results?
- Do students who enjoy the subject material tend to spend more time on homework each night than the other students do?
- Do students who spend more time on homework each night tend to spend less time studying for tests than the other students do?
- Do students who spend more time studying for tests tend to earn higher grades in the class than the other students do?
- 1 and 2
- The survey questions collect data on how much students enjoy a subject and how many hours they spend on hw and studying. As a result, putting together the data will give information about correlation between liking a subject and spending more time on hw (or any other combo). However, the data does not account for what type of student earns higher grades
Find your own dataset
- Create or Find your own dataset. The suggestion is to use a JSON file, integrating with your PBL project would be Fambulous.Continue this Blog using Pandas extract info from that dataset (ex. max, min, mean, median, mode, etc.)
- The data set I chose is synonymous with my CPT project. It is a car database from Kaggle. The US Cars'data was scraped from AUCTION EXPORT.com. This dataset includes Information about 28 brands of clean and used vehicles for sale in US. Twelve features were assembled for each car in the dataset.
import pandas as pd

#read csv and sort 'Duration' largest to smallest
data = pd.read_csv('files/cars.csv').sort_values(by=['price'], ascending=False)

columns = data[['brand','color','price']]

print("--Price Top 10---------")
print(columns.head(10))
print()
print("--Price Bottom 10------")
print(columns.tail(10))
print("Max price")
print(columns[columns.price == columns.price.max()])
print()
print("Min price")
print(columns[columns.price == columns.price.min()])
print()
print("The median price of the cars is: " + str(columns.price.median()))
print()
print("The mean price of the cars is: " + str(columns.price.mean()))
I wanted to try fetching from the database I made
'''Pandas can be used to analyze data'''
import pandas as pd
import requests

def fetch():
    '''Obtain data from an endpoint'''
    url = "https://finalssvgcars.duckdns.org/api/cars/"
    fetch = requests.get(url)
    json = fetch.json()

    # filter data for requirement
    df = pd.DataFrame(json)  # filter endpoint for brand
    print(df.loc[0:5, 'brand':'type']) # show row 0 through 5 and columns brand through type

fetch()
Machine Learning
From Tutorials Point%20is,a%20consistence%20interface%20in%20Python). Scikit-learn (Sklearn) is the most useful and robust library for machine learning in Python. It provides a selection of efficient tools for machine learning and statistical modeling including classification, regression, clustering and dimensionality reduction via a consistence interface in Python.> Description from ChatGPT. The Titanic dataset is a popular dataset for data analysis and machine learning. In the context of machine learning, accuracy refers to the percentage of correctly classified instances in a set of predictions. In this case, the testing data is a subset of the original Titanic dataset that the decision tree model has not seen during training......After training the decision tree model on the training data, we can evaluate its performance on the testing data by making predictions on the testing data and comparing them to the actual outcomes. The accuracy of the decision tree classifier on the testing data tells us how well the model generalizes to new data that it hasn't seen before......For example, if the accuracy of the decision tree classifier on the testing data is 0.8 (or 80%), this means that 80% of the predictions made by the model on the testing data were correct....Chance of survival could be done using various machine learning techniques, including decision trees, logistic regression, or support vector machines, among others.
- Code Below prepares data for further analysis and provides an Accuracy. IMO, you would insert a new passenger and predict survival. Datasets could be used on various factors like prediction if a player will hit a Home Run, or a Stock will go up or down.
- Decision Trees, prediction by a piecewise constant approximation. - Logistic Regression, the probabilities describing the possible outcomes.
from sklearn.model_selection import train_test_split
from sklearn.tree import DecisionTreeClassifier
from sklearn.linear_model import LogisticRegression
from sklearn.metrics import accuracy_score

# Split arrays or matrices into random train and test subsets.
X = td.drop('survived', axis=1)
y = td['survived']
X_train, X_test, y_train, y_test = train_test_split(X, y, test_size=0.3, random_state=42)

# Train a decision tree classifier
dt = DecisionTreeClassifier()
dt.fit(X_train, y_train)

# Test the model
y_pred = dt.predict(X_test)
accuracy = accuracy_score(y_test, y_pred)
print('DecisionTreeClassifier Accuracy:', accuracy)

# Train a logistic regression model
logreg = LogisticRegression()
logreg.fit(X_train, y_train)

# Test the model
y_pred = logreg.predict(X_test)
accuracy = accuracy_score(y_test, y_pred)
print('LogisticRegression Accuracy:', accuracy)